1 Week 1 - Introduction to Remote Sensing
1.1 Summary
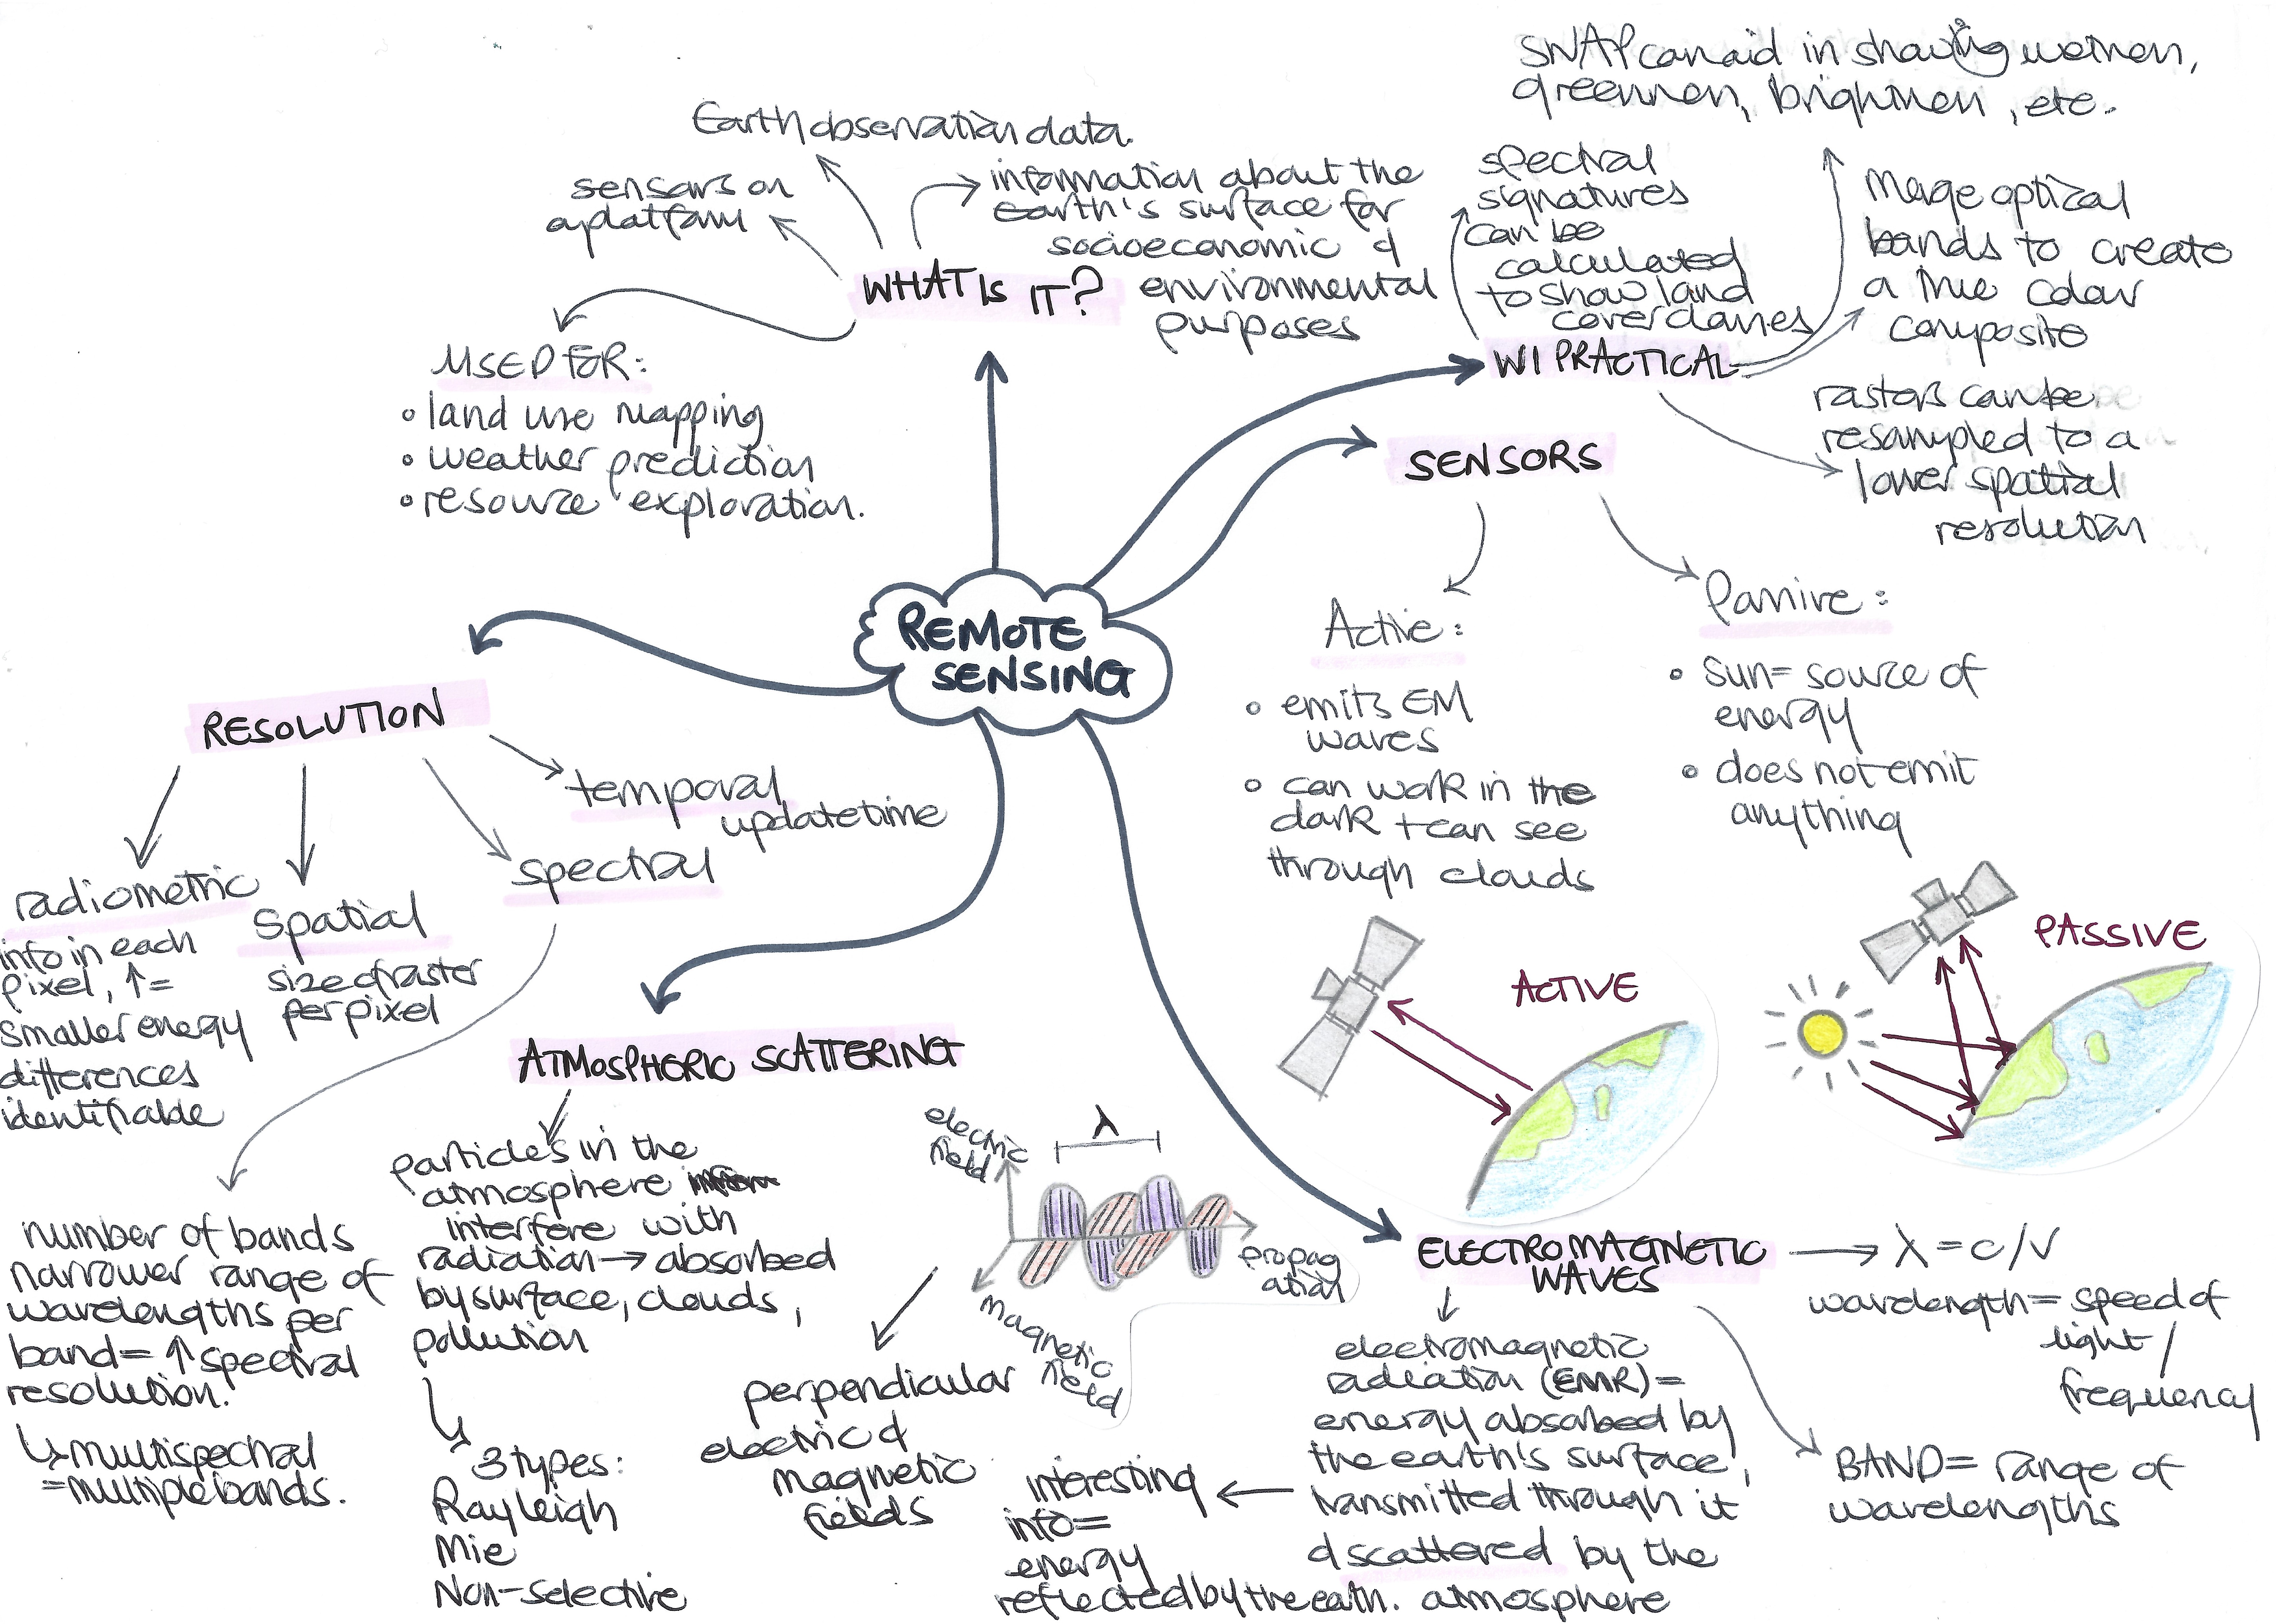
The summary of lecture 1 will be provided in a hand drawn mind map as shown below, as I find mind maps really useful for over viewing topics! The week 1 lecture covered the basics of remote sensing and what it is used for.
1.2 Applications
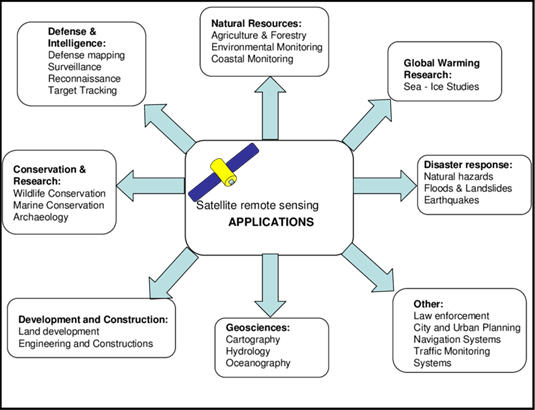
Remotely sensed data is used many different ways. It is often used in tracking both natural and man-made changes such as forest fires and urban growth, and is frequently used in weather prediction through cloud tracking (USGS, 2023). The image below demonstrates the widespread applications of remote sensing.

A specific example of an application of remote sensing is the use of it during the COVID-19 pandemic. It was used in different ways, such as to provide meteorological data to inform on disease transmission determinants, mapping ground features and activities to anticipate industry changes, job losses and food shortages, and how land use data could provide further insight into changing economic activities (Louw, et al., 2022). All of these uses helped to inform policy and have provided information into future mitigation strategies. Another example is that remotely sensed data was used to explain 62% of variations in wealth in a rural area in Kenya which contributed to evidence that satellite data could be used to predict poverty and to help with SDG goal monitoring (Watmough, et al., 2019).
1.3 Reflection
I found this lecture really interesting – it made me realise how little I knew about remote sensing, so everything in the lecture was a learning point! I did not realise how much it is used for, and it has inspired me to look into using it for my own research. It also made me look into certain data sources I have used before which I did not realise were created in part using remote sensing data. In particular, the data from WorldPop (one of the things I really liked about Southampton!), where they estimate populations by combining land cover, night time imagery and vegetation with other data and geospatial sources to produce a random forest regression tree model – really cool! I find it interesting how remotely sensed data can be manipulated to show different things and to highlight certain features of the land surface. In future I would like to use remotely sensed data in my dissertation, especially as it involves climate change where specific environmental factors will be included.
1.4 References
Louw, A., Fu, J., et al., (2022) ‘The role of remote sensing during a global disaster: COVID-19 pandemic as case study’, Remote Sensing Applications: Society and Environment, 27
Vasile, G (2011) ‘Spacebourne SAR Tomography: Application in Urban Environment’, http://dx.doi.org/10.13140/RG.2.2.22514.71365
USGS (2023) ‘What is remote sensing and what it is used for?’, available at: https://www.usgs.gov/faqs/what-remote-sensing-and-what-it-used (accessed: 28.1.23)
Watmough, G., Marcinko, C., et al. (2019) ‘Socioecologically informed use of remote sensing data to predict rural household poverty’, PNAS, 116, 4, pp. 1213-1218